 This NWHM past earnings page last updated 9/20/2021
|
| Period | Past Earnings Date | Adj. EPS |
|---|
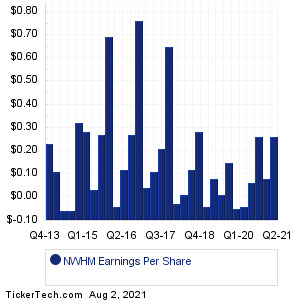
| Q2 2021 | 7/29/2021 | 0.260 |
| Q1 2021 | 4/30/2021 | 0.080 |
| Q4 2020 | 2/11/2021 | 0.260 |
| Q3 2020 | 11/2/2020 | 0.060 |
| Q2 2020 | 7/30/2020 | -0.040 |
| Q1 2020 | 5/8/2020 | -0.050 |
| Q4 2019 | 2/13/2020 | 0.150 |
| Q3 2019 | 10/31/2019 | 0.010 |
| Q2 2019 | 7/30/2019 | 0.080 |
| Q1 2019 | 5/3/2019 | -0.040 |
| Q4 2018 | 2/15/2019 | 0.28 |
| Q3 2018 | 10/25/2018 | 0.12 |
| Q2 2018 | 8/3/2018 | 0.01 |
| Q1 2018 | 5/3/2018 | -0.03 |
| Q4 2017 | 2/14/2018 | 0.65 |
| Q3 2017 | 10/27/2017 | 0.21 |
| Q2 2017 | 7/27/2017 | 0.11 |
| Q1 2017 | 4/27/2017 | 0.04 |
| Q4 2016 | 2/22/2017 | 0.76 |
| Q3 2016 | 11/4/2016 | 0.27 |
| Q2 2016 | 7/29/2016 | 0.12 |
| Q1 2016 | 4/29/2016 | -0.04 |
| Q4 2015 | 2/26/2016 | 0.69 |
| Q3 2015 | 11/5/2015 | 0.27 |
| Q2 2015 | 8/6/2015 | 0.03 |
| Q1 2015 | 5/8/2015 | 0.28 |
| Q4 2014 | 3/6/2015 | 0.32 |
| Q3 2014 | 11/7/2014 | -0.06 |
| Q2 2014 | 8/8/2014 | -0.06 |
| Q1 2014 | 5/1/2014 | 0.11 |
| Q4 2013 | 3/26/2014 | 0.23 |
|

|
| Period | Past Earnings Date | GAAP |
|---|
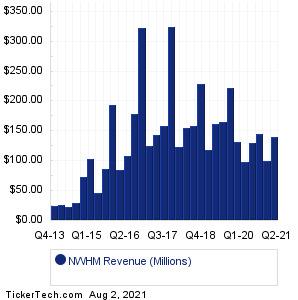
| Q2 2021 | 7/29/2021 | 0.14B |
| Q1 2021 | 4/30/2021 | 0.10B |
| Q4 2020 | 2/11/2021 | 0.15B |
| Q3 2020 | 11/2/2020 | 0.13B |
| Q2 2020 | 7/30/2020 | 0.10B |
| Q1 2020 | 5/8/2020 | 0.13B |
| Q4 2019 | 2/13/2020 | 0.22B |
| Q3 2019 | 10/31/2019 | 0.17B |
| Q2 2019 | 7/30/2019 | 0.16B |
| Q1 2019 | 5/3/2019 | 0.12B |
| Q4 2018 | 2/15/2019 | 229.67M |
| Q3 2018 | 10/25/2018 | 159.11M |
| Q2 2018 | 8/3/2018 | 155.56M |
| Q1 2018 | 5/3/2018 | 123.23M |
| Q4 2017 | 2/14/2018 | 324.10M |
| Q3 2017 | 10/27/2017 | 157.93M |
| Q2 2017 | 7/27/2017 | 144.11M |
| Q1 2017 | 4/27/2017 | 125.02M |
| Q4 2016 | 2/22/2017 | 322.45M |
| Q3 2016 | 11/4/2016 | 177.90M |
| Q2 2016 | 7/29/2016 | 108.86M |
| Q1 2016 | 4/29/2016 | 85.24M |
| Q4 2015 | 2/26/2016 | 194.63M |
| Q3 2015 | 11/5/2015 | 86.98M |
| Q2 2015 | 8/6/2015 | 45.63M |
| Q1 2015 | 5/8/2015 | 102.86M |
| Q4 2014 | 3/6/2015 | 72.98M |
| Q3 2014 | 11/7/2014 | 28.60M |
| Q2 2014 | 8/8/2014 | 22.50M |
| Q1 2014 | 5/1/2014 | 25.56M |
| Q4 2013 | 3/26/2014 | 24.80M |
|
|
Quotes delayed 20 minutes
|
On this page we presented the NWHM past earnings date information for New Home Co. Reviewing that
NWHM Past Earnings for the company, we see that the highest past earnings result in our data set was in Q4 2016, when NWHM posted adjusted EPS of 0.76/share. Meanwhile the lowest NWHM past earnings result was in Q3 2014, when NWHM posted adjusted EPS of -0.06/share. Turning to top line revenue performance, the biggest revenue quarter in our data set was seen in Q4 2017 when NWHM reported 324.10M in revenue, while the smallest revenue quarter was Q2 2014 when NWHM reported 22.50M in revenue.
Any self directed investor doing their due diligence on NWHM or any other given stock can benefit from
researching all of the New Home Co past earnings — and here, we present each quarter's result all together
on one page for easy comparison. Studying this information can help when projecting future earnings, as well
as determining whether the past earnings trajectory justifies the current stock value.
That's why we bring you PastEarnings.com to make it easy for investors to investigate
New Home Co past earnings, or the past earnings information for any stock in our coverage universe.
And in your continued research we hope you will be sure to check out the further links included for earnings
surprises history (beat/miss data) as well as next earnings dates for NWHM. Thanks for visiting, and the next
time you need to research NWHM past earnings or those of another stock, we hope you'll think of our site, as your
go-to past earnings research resource of choice.